Carbon Debt Explorer
An interactive dashboard showing how regional carbon debt shifts with the equity assumptions behind it
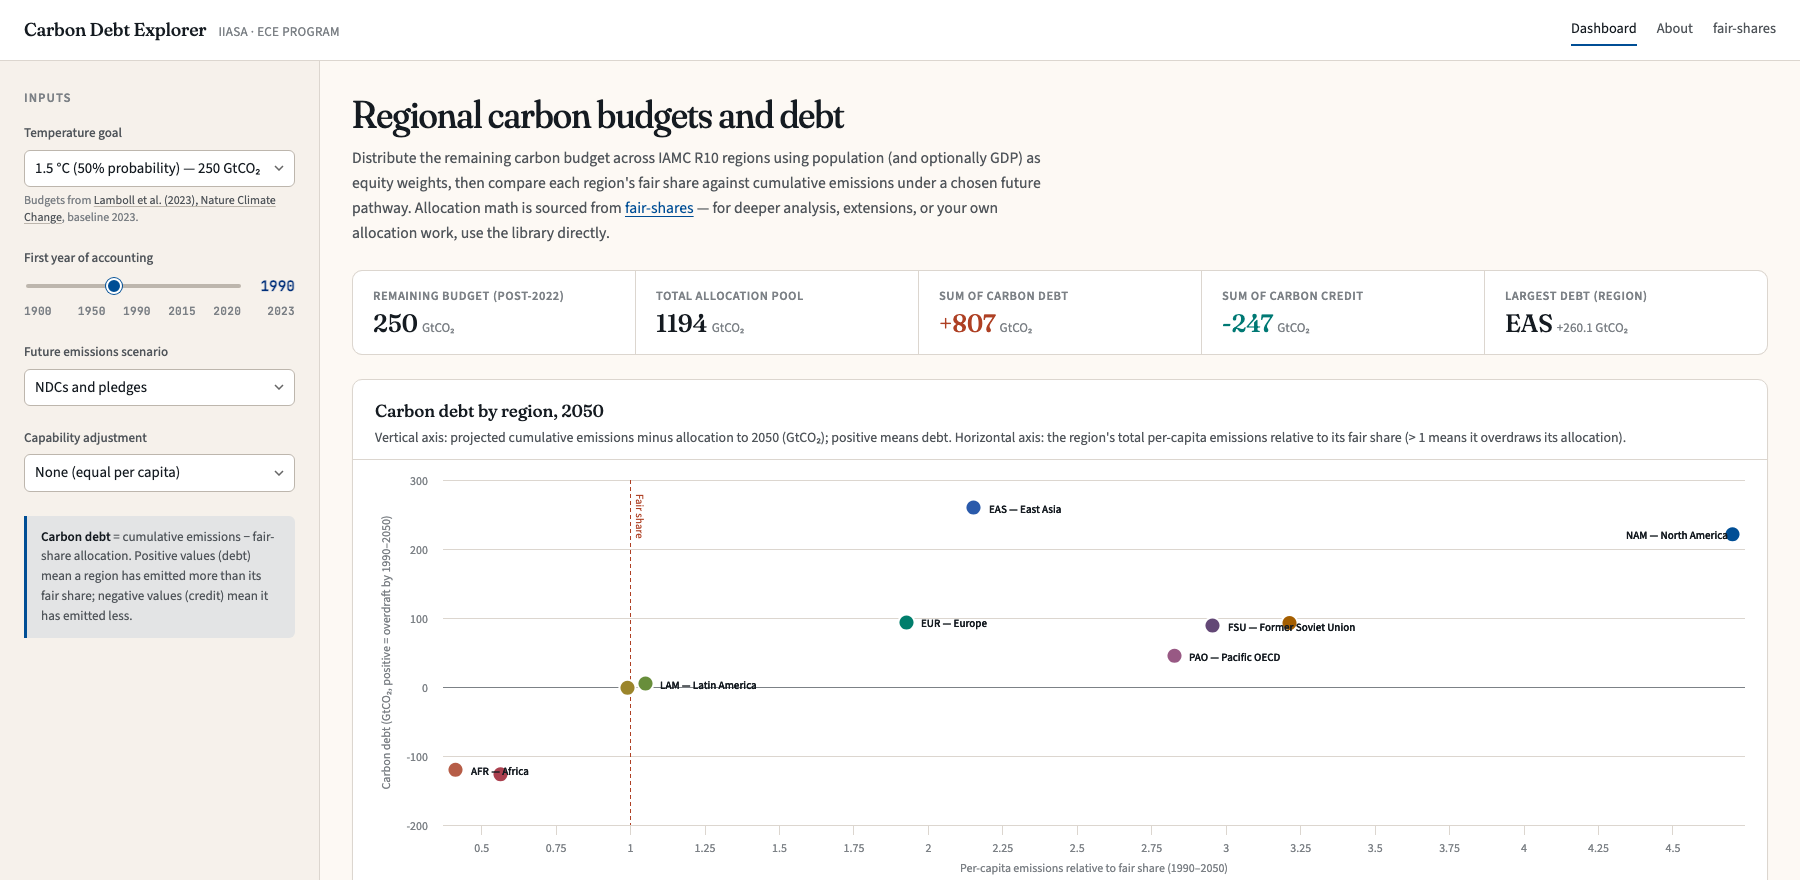
The Carbon Debt Explorer is a browser dashboard that divides a remaining global carbon budget across ten world regions (the IAMC R10 set). It compares each region's fair share against its cumulative emissions, historical and projected. The comparison yields one number per region: carbon debt, defined as cumulative emissions minus the fair-share allocation. A positive value is an overdraft on the budget; a negative value is credit. The accounting framework is the one set out in our net-zero carbon debt paper (Pelz et al., PNAS 2025).
The debt number depends on the equity assumptions behind it, and each is a value judgement the user makes. Users choose the temperature goal (1.5 °C at 50%, or 2 °C at 66% or 90%, with budgets from Lamboll et al. 2023). They choose the first year from which historical emissions count (between 1900 and 2023). They choose the future emissions pathway (NDCs and pledges, or current policies, from REMIND-MAgPIE regional aggregates). Finally, they choose whether per capita shares are adjusted for capability using GDP. The dashboard shows how far the numbers shift when a user changes any of these choices.
It was built in 2024 as an R Shiny app to support stakeholder engagement within the ELEVATE project. It has since been rebuilt as a static site whose allocation mathematics come from the fair-shares library, so the numbers stay in sync with that codebase. It is preserved as a legacy tool; new allocation work belongs in fair-shares directly.