Measuring and explaining household access to electrical energy services: Evidence from rural northern India
Electrification policy must look beyond connections to supply availability in hours per day
What a connection does not tell you
India's rural electrification drive delivered connections at remarkable speed, and connection rates are the statistic through which that progress is reported. A connection is a precondition for using electricity, not a description of what a household can do with it.
Two households recorded identically as connected may receive very different supply, and the dimensions along which supply varies are not interchangeable. Availability, measured in hours per day, and reliability, measured in outage days per month, are treated as parallel dimensions in multi-tier measurement frameworks, which commonly aggregate them by taking the worst-performing dimension to define an overall tier. Whether that aggregation reflects what households gain is untested. We ask how disaggregate dimensions of supply relate to household utilisation of distinct electrical energy services and to satisfaction with supply, and what that implies for measuring electricity access beyond connections. If the dimensions differ in the marginal utility they deliver, then collapsing them into a single tier discards exactly the information a planner needs.
Eight energy services against disaggregated supply dimensions
We use the two-wave ACCESS panel survey of rural areas across six contiguous states in northern India, covering 8,563 households in 714 villages in 2014-15 and 9,072 households in 756 villages in 2018. Appliances owned are mapped to eight distinct electrical energy services, spanning lighting, information and communications, entertainment, space cooling, refrigeration, mechanical loads, thermal loads and heating, and cooking, and the primary outcome is the count of distinct services a household utilises.
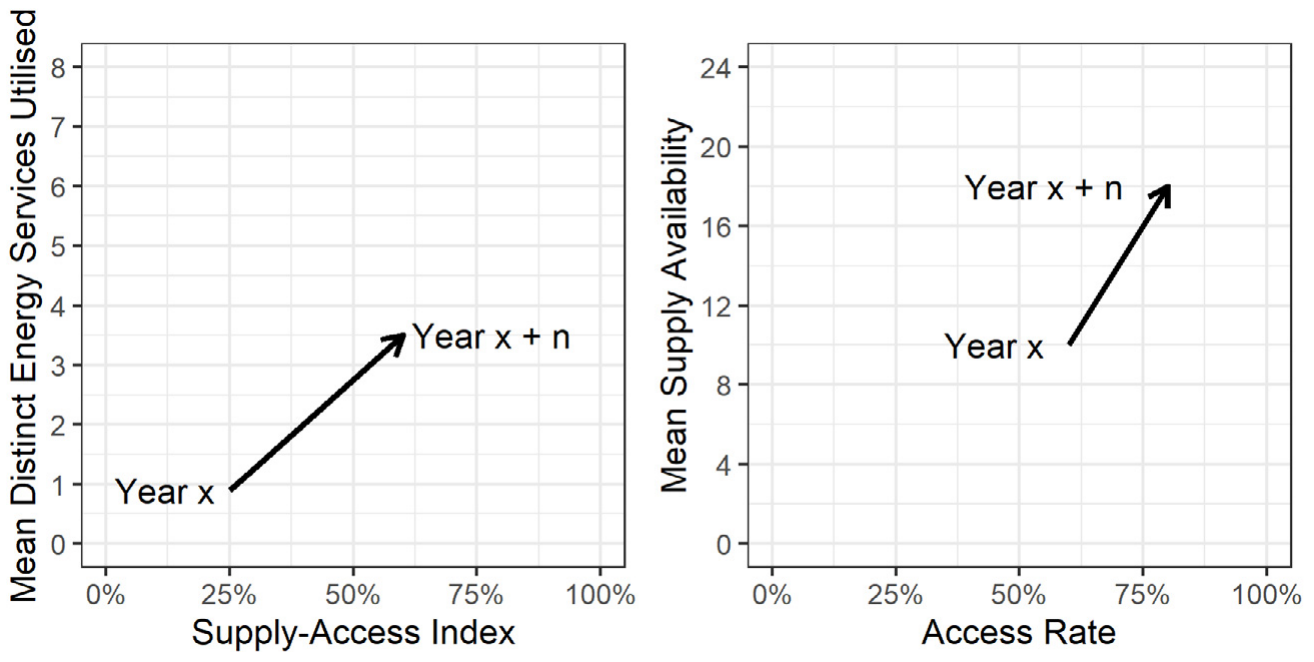
Supply enters both as continuous availability in hours per day and reliability in outage days per month, and in their binned tier forms, which lets us compare the two representations directly. We also propose a supply-access index, defined as mean supply availability hours across electrified households multiplied by the share of households with access and divided by 24. We estimate survey-design weighted linear regressions of total services utilised, and weighted logistic regressions for supply satisfaction and for per-service utilisation, reporting average marginal effects, with robust standard errors clustered at village level and fixed effects run at state, district, village and household level in parallel specifications.
Availability drives service use while reliability does not
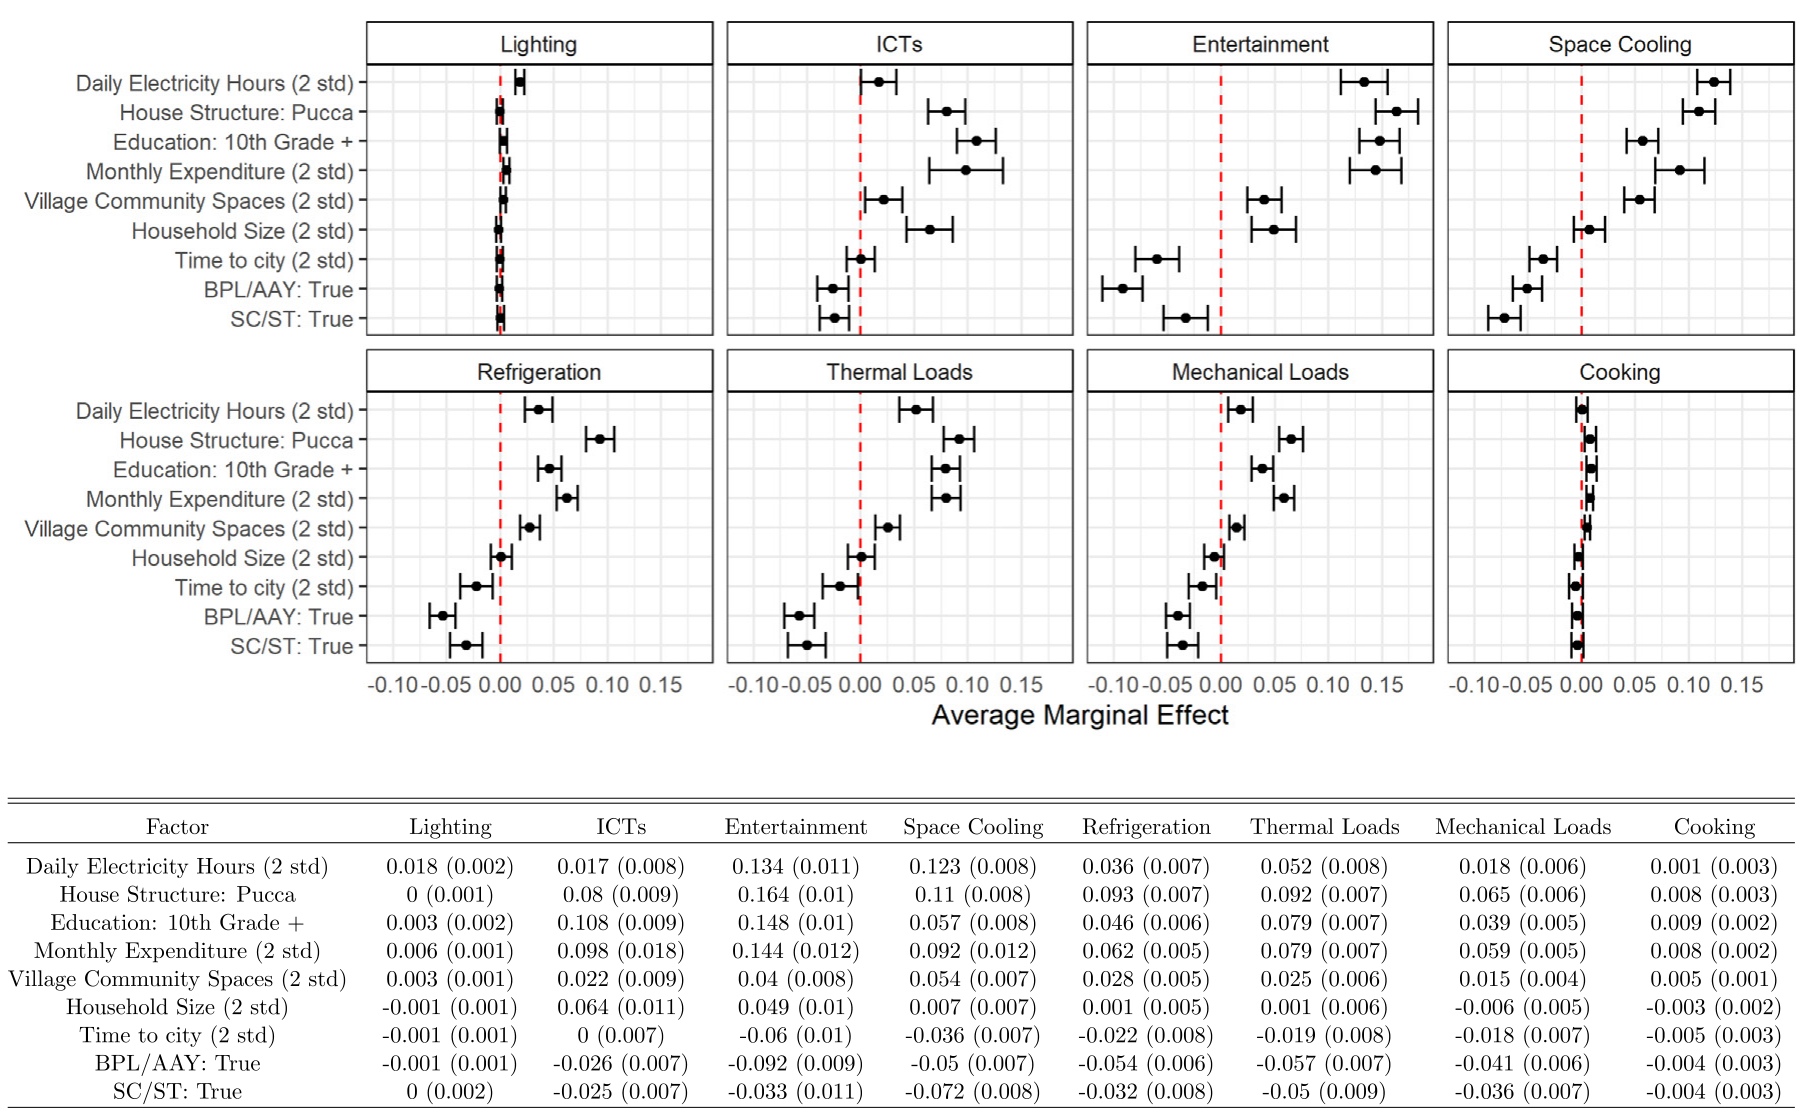
We find that an increase of one hour in supply availability relates to a 0.022 [CI: 0.014 to 0.03] increase in the total number of electrical energy services utilised, which over a twelve-hour improvement amounts to approximately 0.26 more services against a mean of 3.2 services in 2018, and to 38 percentage points higher satisfaction with supply. Supply reliability showed no statistically significant association. Following electrification, households were highly likely to utilise lighting and information and communication services regardless of availability, while a twelve-hour improvement was associated with higher likelihoods of space cooling, at 12.3 percentage points [CI: 10.7 to 13.9], and entertainment, at 13.4 percentage points [CI: 11.2 to 15.6].
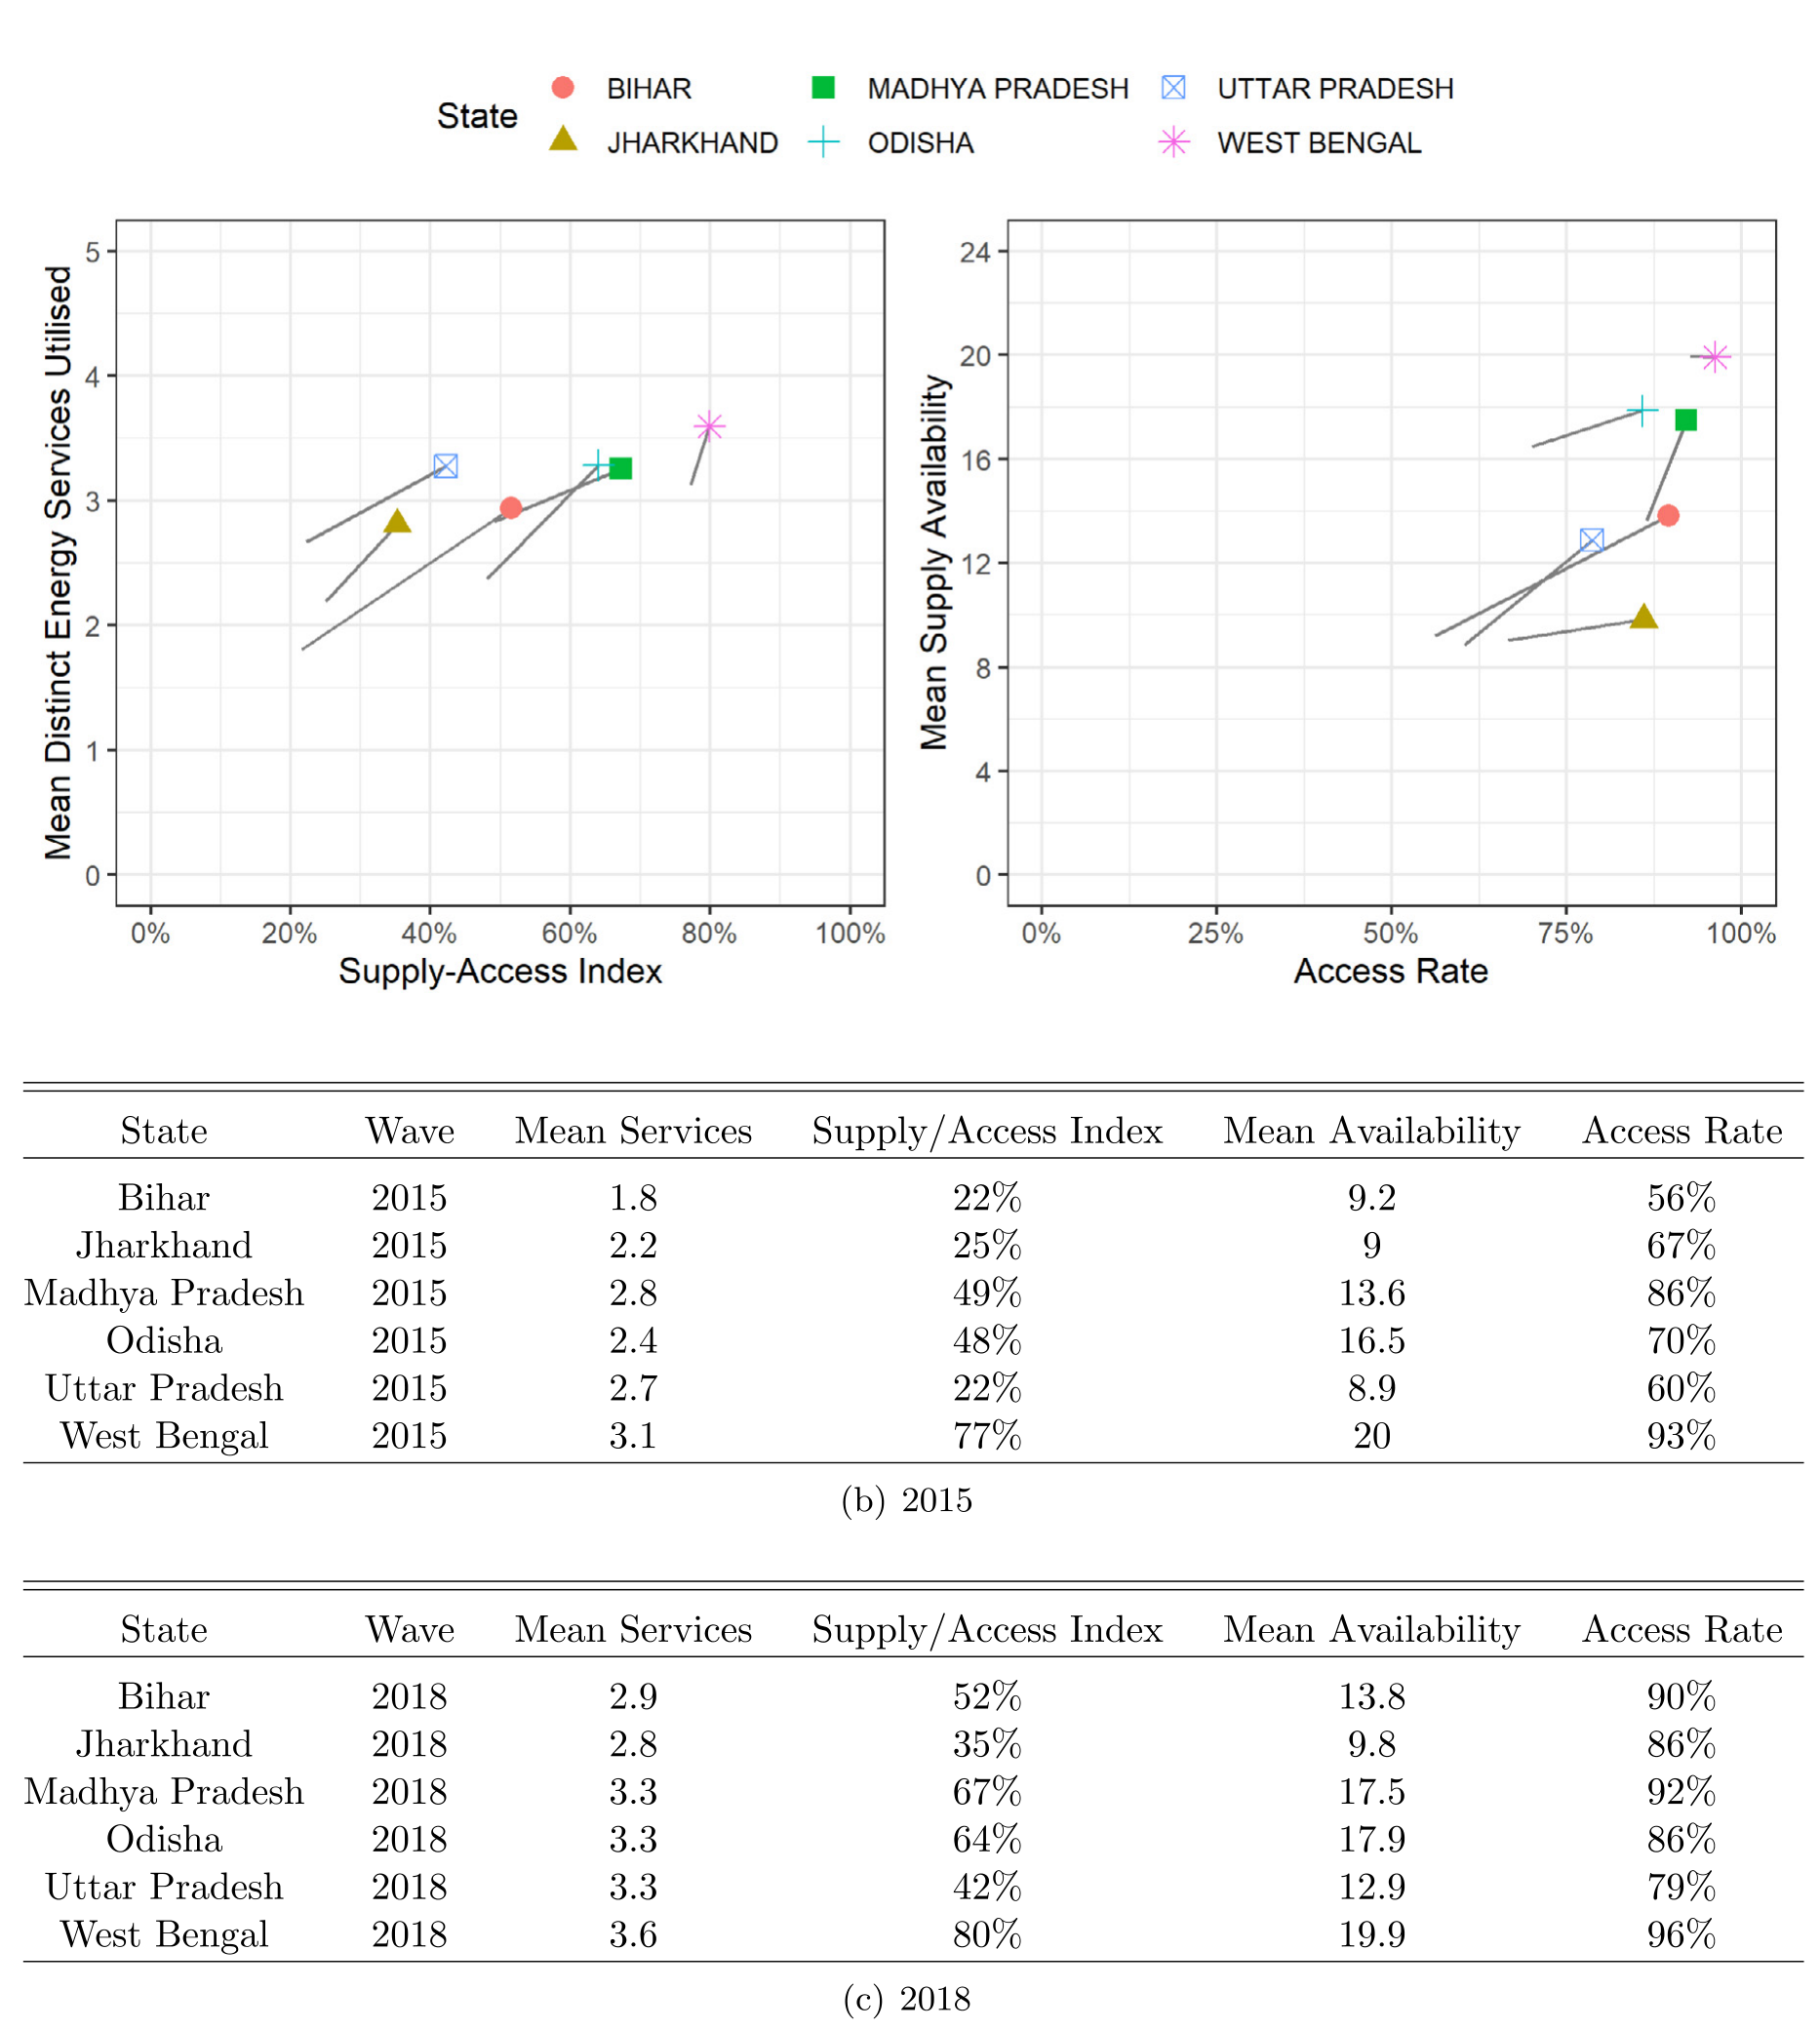
The supply-access index separates states that connection rates render identical. Comparing Jharkhand and Odisha in 2018, both report the same access rate of 86%, yet the supply-access index is 35% in Jharkhand against 64% in Odisha, reflecting poorer supply availability. Wealth, education and housing quality all remain strongly associated with service utilisation.
Aggregate tiers hide what helps households
Using the least performing dimension to define an aggregate multi-tier supply tier from survey recall data will not accurately reflect supply utility, because improvements to dimensions are not equal in terms of the marginal utility they provide households. An hour of additional daily supply and a day fewer of outages are not interchangeable, and a framework that treats them as such will misdirect investment towards whichever dimension happens to score worst.
We argue that policy makers in India should look at disaggregate multi-tier dimensions of supply, paying special attention to supply availability measured in hours per day, for household electrification policy development. More broadly, a disaggregate understanding in terms of electricity supply, but also in terms of heterogeneous energy needs and socio-economic constraints across segments of the population, can support a shift towards electrification policy that focuses on unlocking desired capabilities while using all available technologies.
@article{pelz_measuring_2020,
	title = {Measuring and explaining household access to electrical energy services: {Evidence} from rural northern {India}},
	volume = {145},
	copyright = {All rights reserved},
	issn = {03014215},
	shorttitle = {Measuring and explaining household access to electrical energy services},
	url = {https://linkinghub.elsevier.com/retrieve/pii/S0301421520305036},
	doi = {10.1016/j.enpol.2020.111782},
	abstract = {Household electrification aims to provide populations with access to a wide range of energy services for social and economic development, ranging from lighting to electric cooking. Electrification policy has historically focused on grid connections, however, rather than household capabilities to satisfy energy service needs. We explore a representative panel dataset of households from rural areas of six states across northern India in order to link distinct dimensions of electricity supply with electrical energy service utilisation. Using a regression framework, we show that household electrification policy in India must look beyond connections and consider disaggregate dimensions of supply, paying special attention to supply availability measured in hours per day. Following electrification, households surveyed were highly likely to utilise lighting and ICTs regardless of availability, while an improvement of 12 h was associated with higher likelihoods of space cooling (12.3\%points [CI: 10.7 to 13.9]) and entertainment (13.4\%-points [11.2 to 15.6]) services utilisation. In contrast, mechanical loads, thermal loads, refrigeration and electric cooking remain constrained by household wealth and other factors. Disaggregate supply analysis supports the shift towards electrification policy that unlocks desired capabilities while using all available technologies, both grid and off-grid, to achieve more just outcomes for all.},
	language = {en},
	urldate = {2023-01-28},
	journal = {Energy Policy},
	author = {Pelz, Setu and Urpelainen, Johannes},
	month = oct,
	year = {2020},
	pages = {111782},
}